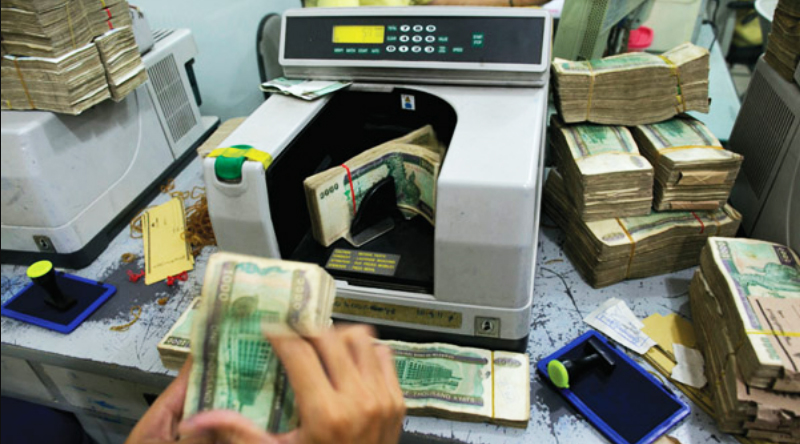
Profit & Loss Of Global Treasure Bank

GTB earned income mainly from loan interests and profit and loss of GTB for the financial


Total Income 65.96 Billion Kyats
Total Expenditure 52.79 Billion Kyats
Net Net Profit 13.17 Billion Kyats

(Provision for Income Tax of 3.4 billion in kyats has already been deducted and prepaid to the Internal Revenue,Department.)

Awarded to GTB Bank ,Presidential Excellence Award On Income Tax Payers' Payment


GTB bank achieves the Presidential Excellence Award on top Income Tax Payers and was listed as the top six among 1000 tax paying companies, and in second position among all private banks for the year 2014-2015. In 2015-2016 income year, GTB was conferred top income taxpayers awarded and Certificate of honor by Department of Internal Revenue of Ministry of Finance as the six largest income tax payer (Myanmar Company) in the whole country, and third position among all Myanmar banks.In 2016-2017 income year, GTB was ranked eleventh tax payer among 1000 tax paying company and in third position banks among all banks.


Distribution of Reserved Funds & Profits

(Million)

ဘဏ္ဍာနှစ် စက်မှုလုပ်ငန်း သယ်ယူပို့ဆောင်ရေးလုပ်ငန်း ကုန်သွယ်မှုလုပ်ငန်း ဝန်ဆောင်မှုလုပ်ငန်း ဆောက်လုပ်ရေးငန်း သား / ငါးထုတ်လုပ်မှုလုပ်ငန်း အထွေထွေလုပ်ငန်း စုစုပေါင်း
2007-08 956 3186 15297 962 779 52146 5519 78845
2008-09 1214 2754 22067 850 1177 59646 6599 94307
2009-10 1394 2502 27443 610 1913 65200 13983 112295
2010-11 1621 2794 44825 7206 11451 98585 223448 187099
2011-12 6797 2567 70427 820 31223 100644 24872 244750
2012-13 2407 8324 98059 14973 343335 107354 347772 300244
2013-14 1196 9742 112514 207798 311818 117833 399912 334713
2014-15 624 8666 119525 21404 35943 111589 55567 353318
2015-16 628 9080 111868 1926 21996 112656 64095 339589
2016-17 309 10773 110584 19230 18617 112029 88576 360121
2017-18 344 20352 104872 392669 18510 142488 77233 403068
2018-19 237.79 3177.63 85737.49 106151.32 40120.44 224179.80 84824.84 5444229.31


Non-Performing Loans (N.P.L)


(Million)

No Budget Loan N.P.L Percetage
1 2007-2008 78845 3596 4.56%
2 2008-2009 94347 5641 5.98%
3 2009-2010 112955 6150 5.44%
4 2010-2011 187099 5969 3.19%
5 2011-2012 243049 5328 2.19%
6 2012-2013 300224 5405 1.80%
7 2013-2014 334713 6285 1.88%
8 2014-2015 353317 25662 7.26%
9 2015-2016 339593 21201 6.24%
10 2016-2017 360121 32043 8.90%
11 2017-2018 403068 142341 35.31%
11 2018-2019 523429.31 112543.40 21.5%